
Foojay Podcast #14: Debugging Tools and Skills for Fun and Profit



 2 min read
6,189 views
2 min read
6,189 viewsLet’s talk about debugging and observability.
We work with debugging all the time, but how well do we know this common practice?
Observability, monitoring, and debugging at scale for your production…
Podcast Apps
You can listen and subscribe to the Foojay Podcast on:
- Spotify
- Apple Podcasts
- And most others…
Guests
- A lot of rubber ducks
- Johannes Bechberger
- JVM and profiler developer
- Worked on the JDWP protocol and profiling
- https://github.com/parttimenerd
- https://twitter.com/parttimen3rd
- https://mastodon.social/@parttimenerd
- AsyncGetStackTrace: A better Stack Trace API for the JVM
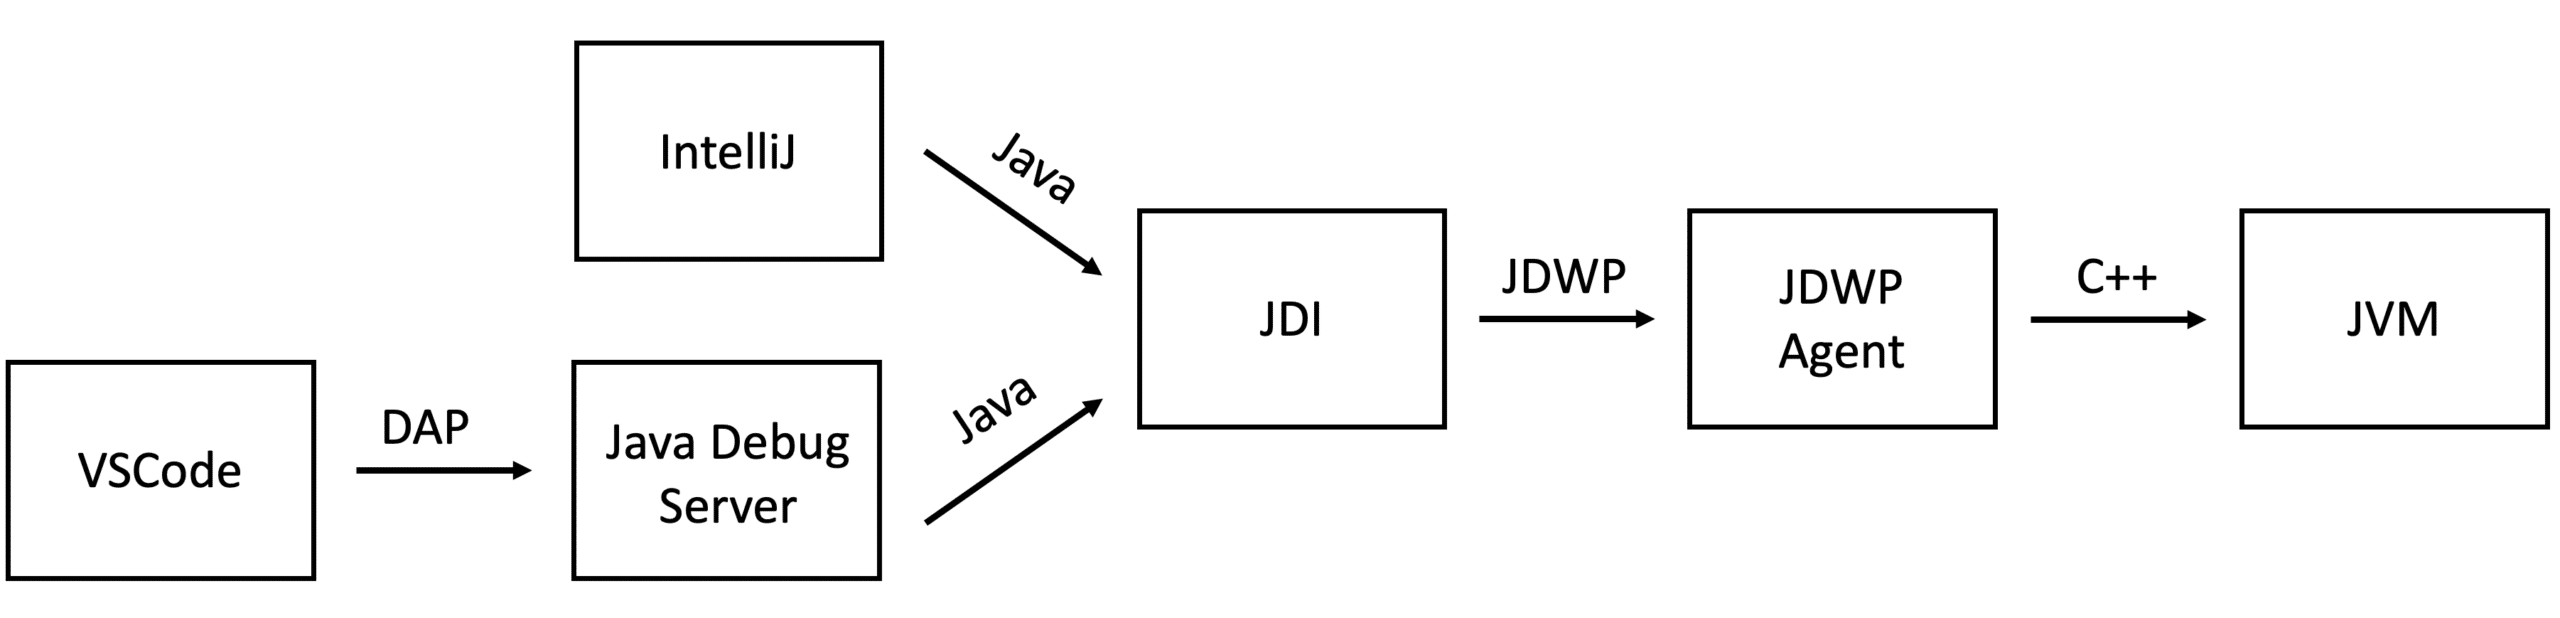
- A short primer on Java debugging internals
- Marit van Dijk
- Developer Advocate at JetBrains
- https://maritvandijk.com/
- https://twitter.com/MaritvanDijk77
- https://mastodon.social/@maritvandijk
- Ties van de Ven
- Software Engineer @ JDriven, Coach @ Jcore
- https://www.tiesvandeven.nl/
- https://twitter.com/ties_ven
- 6 Steps to help you debug your application
Host
- Shai Almog
Producer
Content
- 00'00 Intro and music
- 00'24 About the topic of this podcast
- 00'58 Introduction of the guests and host
- 05'14 Debugging with IntelliJ IDEA and discoverability of tools
- YouTube: Debugger playlist
- YouTube: Profiling tools
- YouTube: Profiling live stream
- 13'27 JDWP protocol
- 19'43 Exception breakpoints
- 20'34 External debugging tools
- 26'55 Observability
- 37'58 What information should you look for while debugging
- 45'46 Be aware of tunnel vision while debugging
- 49'33 What to do if you don’t know where to search for the bug
- 57'05 Outro
Transcript
Automatically generated from the audio, so it can contain errors in names and technical terms. Suggest a correction.
[0:00] Hello and welcome to this new edition of the Foojay podcast we’re going to talk about debugging and observability we work with debugging all the time but how well do we know this common practice observability and monitoring are debugging at scale for your production welcome to the Foojay podcast all your news about OpenJDK lots of developers treat debugging like taking out the trash running through the door with their hand on their nose trying to get rid of that awful smelly bag we don’t learn it in University and there is just so much to know both about the theory and the underlying tools but debugging hits dead end when we go to production we can’t place a breakpoint on the cloud that’s where monitoring and observability tools kick in we’ll discuss the Fantastic things available for us in the JVM today we are talking to some very interesting people I’ll let you introduce yourselves so I won’t botch the names hey everyone I’m tis van Fen work from a company called j-driven from the Netherlands and I have a special interest in software engineering fundamentals I really like the why instead of the how and basically that’s
[1:17] In a way because of debugging because in the first five years of my career I spent almost all my time debugging and because of that I started realizing hey this thing keeps going wrong counter finds ways to actually improve the code in a way that this can’t go wrong anymore you can say that basically my all my current interests are one way or another related to five years of debugging code I noticed I got quite good at debugging since I was solving bugs a bit faster than some colleagues here and there and I thought hey that’s a bit weird since I’m not smarter than them so I’m obviously doing things differently than they are than they do so I actually took some time at some point to figure out what I was doing differently and wrote a blog post and Java magazine article about it over 20 years in different roles in different companies I recently joined jetbrains as a developer Advocate just last July 2022 prior to that I was a software engineer at a Dutch retail platform where I worked for five and a half years in three different teams on top of that I’m an open source contributor conference speaker
[2:27] Occasional guest on webinars and podcasts like this one I write articles that you can find on my own website on Foojay and on the IntelliJ IDEA guide I’ve contributed an article to the book 97 things every Java programmer should know edited by Kevin Henny and Trisha g hi I’m Johannes I’m probably the youngest one and around Paul leave by by far I started last year at sap in the Submachine team we built the best JDK distribution out there and we’re having lots of fun contributing your own source project related to OpenJDK project so for me specifically I’m working in our team in the serviceability field so I’m working mostly on profiling stuff I wrote The Chap 435 candidate which hopes to improve profiling for everyone so it’s also why I debugged the whole day today interesting things but mostly on the C plus plus side might take my entry into Java debugging is because I did some program and also such as University and even tried to do a PhD in this field and then later I’m working in sap I decided to look deeper into the jdwp protocol or Java debug wire protocol and my work
[3:51] Like quarter of a year anniversary on a research project in this field a few weeks back I wrote on primer into this protocol and that’s the reason why I’m probably here great everyone so I’m shailamog and I’m probably the oldest one here I’ve been programming professionally for over 30 years during this time I’ve been a consultant so I worked with over 100 companies and debugging was sort of a secret weapon when you’re a consultant because you need to walk into a company where you don’t know anything and still give something of value during this time I worked at San Microsystems for quite a long while then Oracle I work built jvms and did all sorts of bad stuff wrote lots of Open Source Code a lot of that including founded codename one and several and other companies I recently wrote a debugging book for aprs practical debugging at scale that talks about the entire practice of debugging I also worked at Lantern which is an observability tool that essentially lets you do debugging in the cloud and the developer advocacy there and other things I have a YouTube channel as well where I’ll talk about
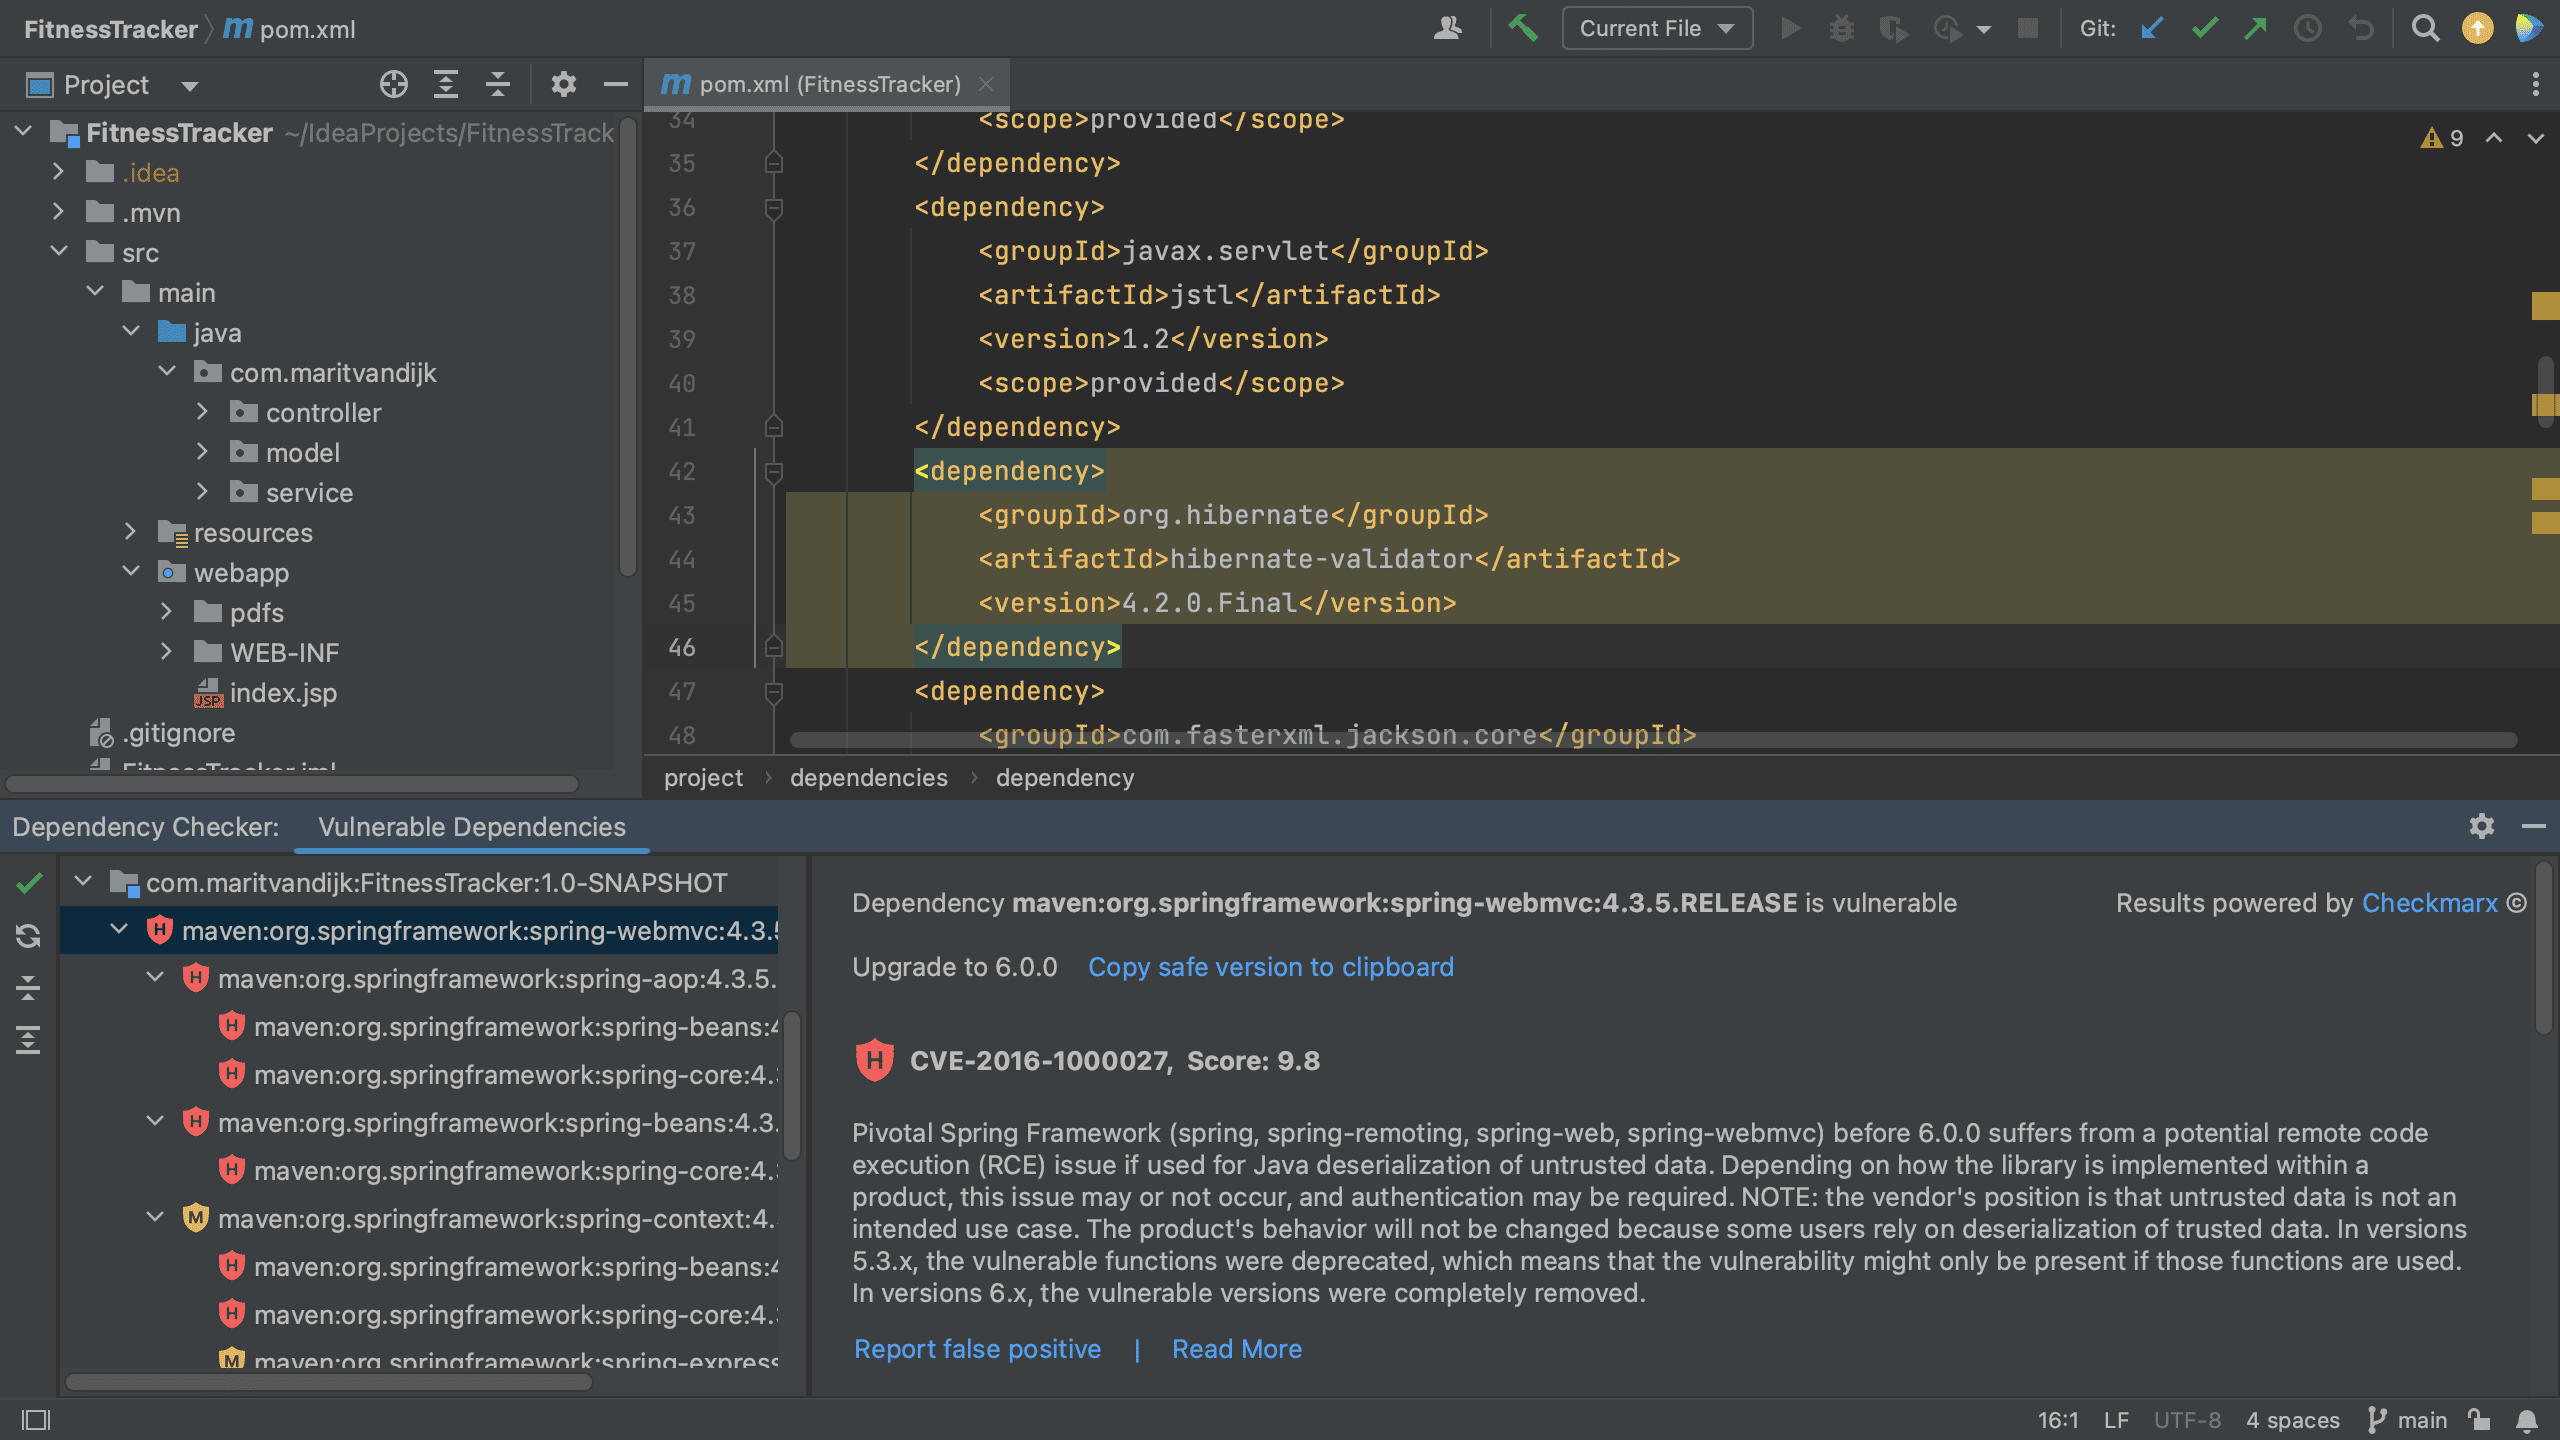
[5:07] Debugging and an online course about that debug agent you can find me all there let’s get started with the questions and there’s sort of questions for everyone so feel free to answer them I talk a lot about debugging and I use IntelliJ IDEA Myriad I know it’s it’s great it has remarkable features but their discoverability is relatively low developers just don’t know how to use these amazing tools things like marker objects renders Etc how can we educate developers around these subjects I think that’s a great question which ties in with my job nicely and I have to say that first of all I think IntelliJ IDEA is a great IDE or I wouldn’t have taken this job I’ve been saying that for years prior to joining jetbrains and I think it’s great because it lets me do my job without getting in the way and it didn’t take me a lot of time to learn how to start using it other than unlearning saving all the files but it is the only one that I found that really Delights me in that it offers me features that I didn’t even know I wanted whereas the other ones or other Ides that I’ve used don’t but it’s also a very powerful tool with
[6:28] Lots of features and I think not everybody might know what features are there or might not always they might not always be obvious so there are two tips that I have for people to find those features one is to use search everywhere which is just shift shift and you can look for whatever you’re looking for like profiling or debugging or any other type of feature that you need and the other is find action which is command shift and a on Mac or Ctrl shifts and a on Windows and Linux and then you can find whatever it is that you’re trying to do which really helps to find the features so right inside the IDE but of course we can only search for what we know to look for so another favorite way for me to learn about new features is actually pairing with other developers because they will do something where you’re like what did you just do and you learned some great new shortcut or feature or whatever and those are like the unknown unknowns and the only way to learn them for me is to see other developers also developers like yourself who are talking about our tools and sharing what they
[7:38] Find useful and why they find it useful you can learn new things from that and finally of course we have a lot of videos on our YouTube channel about debugging some short ones by malagupta and some longer ones by Igor ushikov who is the team lead in profilers and debugging so he really explains in depth all of the options and that’s really great and in addition to that we have the feature trainer right inside the IDE we have a guide with tutorials and tips Twitter tips for short tips on tricks in the IDE and of course the blog and so we have different content and different styles depending on what you prefer one of the things I’ve noticed and I wrote a blog post about it for Foojay that should be out by the time you hear this is that Visual Studio code for instance chose the path of simplifying because of that discoverability problem people don’t know about features like Trace points so because they’re hard to discover in IntelliJ you need to know to control click in this in the side in the gutter area or need to uncheck the suspend option in the breakpoint dialog and in vs code they made it much simpler
[8:56] But on the other hand they removed a lot of the functionality that’s more complicated in order to make that feature more discoverable and other features more discoverable and to me as a person who does a lot of debugging and by the way are very much connected to what you said about peer programming because I started learning about debugging 26 years ago from a mentor who I sat down with and I think that choice is problematic but I noticed that some people just don’t know what they’re missing out on because of their discoverability problem one of my thoughts was the code with me feature that jetbrains has that lets you pair program remotely because we’re all lots of us are more remote now than we used to so that’s probably also a good way of discovering things and Shameless Club you know also my blog has lots of information like that about the IntelliJ capabilities and videos because IntelliJ IDEA has been around for so long it’s it has a lot of features and we make obvious choices to not put everything directly in the UI because it would just get cluttered with too much stuff
[10:13] The downsides being that people don’t always know what’s there and that’s why people like yourself who are enthusiastically sharing what they’ve learned are really really great and any way that you can paner and code with me is the way to do so remotely and learn from each other is really great what I found interesting when looking into different ways to use profiles especially in the diff into the differences between vs code and IntelliJ I found that vs code uses essentially the code from Eclipse so that’s that’s interesting from the technology stack perspective that I think one of the reasons why vs code doesn’t have that many features is that they choose to work with the Eclipse code base and the size I remember because I’m also an IntelliJ user for a long time is that Eclipse has had less features so I think that’s also one one of the reasons and were found interesting when looking into the protocol as a whole the thing that I use all the time which is the evaluate code feature of Intel J how it’s implemented under the hood because if I may elaborate it’s really a cool feature because
[11:29] What most people think is that hey yeah it’s it gets sent to the JVM and the JVM does everything but when you look deeper and look how it’s implemented directly on the JVM it’s it’s essentially that you’re debugger in your IDE contains some Java interpreter so Java interpreter that essentially interprets the Java code that you put in but every time you say okay you write a local variable or for example call Muffet this is then relied to the JVM using the jwp protocol and so it’s quite instrumental to not only learn these cool new features in LJ or eclipse or vs code have but to also learn how the effect to Performance that’s interesting because it’s of course not a trust implementing it in an interpreter in the IDE side and it’s if you have short enough build times quite advisable to get larger validation code for example for conditional breakpoints or for watches directly into the code there was a feature in jdwp at least while back they had of they had some space in a field for break points where you could input a string but the problem is it’s for future use as they wrote in the comment or the
[12:53] Description and so it has never been implemented and I think after a while with kotlin Scala and other languages it’s quite infusible that the JVM knows how to interpret the code because then the JVM would need a cuddling compiler scalar compiler crew we compiler a closure compiler or what else and I think the IDE does a good job but keep this in mind when you’re evaluating in break points that it used a lot of the time or if you’re doing it over the wire with the remote debugging features that’s great about jdwp if we’re heading in that direction and they evaluate issue both of them are very interesting I actually worked in Atlanta we did an evaluate implementation that worked essentially in production environments and it used also an interpreter written for efficiency and it limited the overuse of conditional evaluations and things like that in order to not over exert the JVM in the production and this is one of the things that always bothered me some people make the mistake of trying to connect with jdwp into production and that is insane in terms of performance in terms of security and
[14:21] Also in terms of internal security because a malicious developer and you know sixty percent of hacks are internal can just place a breakpoint in the place where users are logging in and just sap out all the passwords for all the users and it’s really really easy to do that jdwp is really it’s a great protocol it’s just not designed for things like production which is why we have observability capabilities I might just disagree on your part where you say it’s great protocol I think I for me just as a context I worked on this for a quarter of the year because I also saw that jwp had some difficulties I agree with and I wanted to solve it and the main thing for people that know the protocol which is essentially everyone out there is that the protocol has written in a time where nobody thought about something like production ebaying or where nobody even thought about that you’re not even about security machine no security it’s the deep end growth because that’s probably not an issue because you when you have evaluate some when you can evaluate arbitrary code then that’s okay then you
[15:34] Don’t care about Security in this group but the problem is it’s not protocol list has lots of small packages the protocol is really hard to parse because you have to know State because for example they chose to reduce the size of the size of the packages just by like if one byte to not pass the type of the value so if you have a packet you have to and this package contains for example the well u4 field you have to know the type of the field to pass it so it’s really hard to for example integrate some jwp percentage into Wireshark because you have to know the whole communication just the power of the protocol just for saving a byte also a protocol is really has really small packages so you get so you don’t get a lot of information and it’s nothing that you would currently probably right and there is no Java implementation out there that can parse and generate packets and responses I wrote the first just a Shameless black year to a road one you can find it at my GitHub account on the part-time nerd it’s a protocol that that’s like from the 90s and you see it but the
[16:54] Thing is it worked and people like the people at jet paints and those are the clips to do lots of things to make it usable again and to make also the layer buffer to the jda usable and I’m grateful that they did it because on the jwp level it’s not a great thing and it’s it’s even it’s it’s cool when you see oh I can use evaluate and it has syntax and it has completions and everything and you look at the underlying protocol and see how many thousands of messages are going over the wire so please do yourself a favor and when you do that debugging looked at your server your debug is quite near to you or at least if it’s not that near don’t use conditional breakpoints with large conditions yeah that’s a killer and you’re correct I was being nice when I said you know you don’t you don’t normally say something sucks when you do a podcast but you are correct it does indeed suck but to be fair it’s amazing that it works and the layers that it has are fantastic and no other platform has anything remotely like the JV the JVM has in terms of the back end stack jdwp is indeed very problematic
[18:15] But I can tell you that we use that same protocol to debug phones and I’m talking about j2me phones back in the day so you didn’t have a regular TCP connection to the phone you had to use ad commands which I don’t know if anyone here ever worked with ad commands trust me you don’t want to and we were able to tunnel jdwp on top of that to do on-device debugging which is fantastic it’s a very resilient flexible protocol that does indeed suck but honestly the problem is also pretty humongous and the nice thing is that it’s wrapped very nicely as I noticed you posted in Foojay a great article about the jdi abstraction on top of that and all of that level of abstraction and this is a much more convenient API to work with if you ever want to actually implement the debugger yourself not that it’s something that I would recommend that anyone does but it’s a it’s a nice exercise to do some Automation and things like that which is actually relatively simple to do in Java and that’s a small miracle if I would say so if people do want to implement debuggers and other tools we’re always hiring
[19:39] Developers excuse me and I’m just very grateful for intelier that they actually did that work because evaluate expression is actually my favorite like my number one used debug tool second being probably break on exception and breakpoints on condition those are basically the three I by far use the most if we’re talking about the way about the exception breakpoints I would recommend using them with the class filter otherwise they’re not very useful and I wrote a post to Foojay about that as well in exception breakpoints they often stop on exceptions within the JVM itself if you mark all exceptions and that’s just terrible that’s totally useless but you can use a class filter in the exception dialog and there is a video there and everything I explained the whole thing check it out in Foojay let’s move on any external debugging tools that are personal favorites of yours command line tools and jvms a lot of them and also external tools personally I love s-trace I don’t know if you’ve used it it’s a Linux command line tool actually built by San marcosystems before D Trace which is amazing so many Innovations came from
[20:54] That company and we’re are still with us today and when you run it with an application even if it’s a Java application it shows every system call made by the application and you can filter that list obviously so it won’t run so slowly but you can see every file opened by your application every network connection every sort of thing that requires a system called and that’s a really useful tool when you want to debug something and verify that your application is behaving as you would expect any similarly favorite tools that you have other than the IDE when you’re doing debugging I know that as developers we love to go for technical tools but I’m actually going to go the opposite direction and say that outside of debugging inside the IDE one of my favorite debugging techniques is rubber duck debugging which I know from your logo you also like so for listeners who are not familiar rubber duck debugging is basically explaining your problem to a rubber duck if there is no person available and by explaining your problem sometimes you’re able to figure it out or just by structuring your thoughts
[22:11] Like what even is my problem make some Headway in where to look and then you can look for technical tools that can help you figure that out and in fact my husband and I have a shorthand where sometimes we’re talking to each other explaining our problem Midway the explanation we figure it out and we’re just like oh just say quack and the other goes quack or if it’s on chat sends a duck emoji for you know thanks for being my rubber duck I’m sure Johannes has some technical tools though for me one one of my technical tools is just doing printfs like for example I today hacked a bit on OpenJDK try to find a bargain fix bug and didn’t find it because in open JK world when you have a profile a bug it’s often Eisenberg that appears but you cannot reproduce it and then for these bugs it’s quite hard also in the travel World so the easiest options would be to simplify a problem for example you could do something like C reduce when you’re in the compiler World to reduce your problem or use tools from the functional world that allow you to reduce your problem case to a smaller case and test it all the way
[23:33] Down this really helps because the best thing is to have a minimal working to have a minimal use case where the buck occurs because when you have a back to the quilt like a large machine after a few hours in an unknown customer product then you essentially lost so reduce the problems to something you can reproduce in addition to what marriage said about Marine techniques I don’t have that many tools I basically use whatever is needed but in the day it comes down to when debugging the one of the first things you want to do is produce problem space because I usually work with a lot of Enterprise applications so like from then the microservice backend okay the clouds and if there’s a bug I first need to figure out where it is and step one if something is wrong in the front end I tend to use Chrome with the Chrome debugger to see network traffic to see if like if this value already wrong in the Json or is it after or is it correct and adjacent so that means the problem is in the front end after that if I know it’s in the back ends I can basically start figuring out from what service it comes and basically I
[24:50] Just need to figure out after a bit of thinking with rubber duck programming he did for Marriott but what could it be logically and otherwise just simple things like curl from one pot to another pot just to figure out what’s going wrong you don’t need that many fancy tools the main thing you need to do is figure out what is the most effective way to limit your problem space that you’re in the correct microservices and probably in the correct class as quickly as possible that’s indeed correct but you need to split the problem and isolate it if you are very efficient in squatting down the problem like half in the problem every time then in like two or three steps you’re basically within 100 lines of codes away from where the problem resides I love using cool as well and one of the neat tricks I found in both in Chrome and Firefox in the network inspector you can actually get a curl command line so you literally right click the network request and you can get values for curl or for post manifest yourself inclined and just paste it options there yeah and it’s so convenient and unless you actually went
[26:05] Out looking for it you wouldn’t know about it some of these debugging tools like another one from your end when printf debugging is so common but a lot of times when I need to debug things I prefer using Trace points which is kind of like print of debugging only that you can’t forget it in the code later on so there’s sort of the similar advantages of not disrupting the regular execution of the code and coming up with something that you can still keep as a specific session that you can do conditionally Etc it does have a greater impact on performance if you do it conditionally obviously when compared to regular printfs but I find that in the other regards it’s very very useful let’s move on to observability as you mentioned Enterprise it’s required you can’t build a modern application without proper observability in the production so the agent API is something that’s if you’ve ever used an observability tool you’d usually bind it to the JVM with a Java agent or the native agent Etc there’s several permutations of that command line that allow essentially instrumenting a production application
[27:27] With almost no performance overhead and having worked on an observability tool that’s portable not just for Java but for python node and other VMS Java pretty much stands alone when it comes to the level of observability that we can do both in the power of the tools and in the performance we were able to build a tool that has almost no real impact when it’s turned off still running in the background but sort of just waiting for commands and it had almost negligible impact and the similar a similar tool running in other platforms not to badmouth those terrible platforms costs 10 and more so I won’t name names but you know pretty much all of them didn’t perform all that well so we were able to do some tricks to sort of work around some of that but still the capabilities that the JVM exposed while still being performant stand alone in this field I was wondering if any of you had similar thoughts contradictions or anything like that I want to agree with what you said in that of course Java has been around for a while and possibly as a result of that the ecosystem around Java is quite mature so it means that
[29:04] There are good two links and we had a talk about package managers for example at the Foojay dinner at full stem last week where we were comparing package managers for different languages and actually Java is not so bad as much as we like to complain about yamul and XML and other stuff we have it pretty good I think in the Java ecosystem I mean that there’s lots of tooling that we can use for everything from writing tests to debugging to observability like you’re saying I find it quite interesting when you hear people talking about Java with profiling and also with observability with debugging and often if I may say it feels like that they want to be a Java to be this exceptional great great language but when you look for example regarding debugging into what I can do with pie dramats not that far away from what I can do with Java and it’s usually it covers like 90 of my use cases and the only other use cases can be mostly covered but just writing a few lines of code which is easy and in Python for example because you can you don’t have to rebuild the whole project
[30:17] And also for example in JavaScript it’s the same that they really create debuggers when you look at the debuggers that you can use on the front end I liked they under Traders as to travel ideas because they aren’t that long around yet but they are still really great and I feel that this exceptionalism that Java is like the best and everything will doesn’t cut it because Java is there for a long time and this has a great ecosystem but I think every econ system has enough tools to debug in that else people won’t use it for production so I think Java has good parts and it’s ecosystem is but it also has Parts where it’s missing for example c-sharp is also with the.net runtime doing a really great job in all of this with Microsoft bring in their own debugging protocol and the language server protocol many languages probably gained in the future similar debating and observability features as Java does also a lot of these features are basically language independent another popular observability features these days metrics and such are all going over rest this case with the sidecar you can have
[31:38] Things like esdo where basically a lot of these observability things become language independent so in that sense Java has its agent which may have set it apart but a lot of these things form observability can be outsourced to basic other applications so that every language has those features that is partially true if you look at agents for things like open Telemetry and performance agents similarly in apms and similar tools and measure the scale of impact that they have on the production environment that they’re running in the JVM has a better Tooling in that regard more seamless more apis related to that and that’s because Java is deep history in the Enterprise that other tools like python just don’t have to the same degree if you look at just management beans and the capabilities available there and compare them to something in almost any platform.net has management capabilities because Microsoft does have some Enterprise bonafides there but it’s not uniform around all the platforms supported by CLR and there’s a lot of complexities between the versions and compatibility the that aren’t necessarily as
[33:20] Compatible across the range of their offerings so Java and to a lesser degree.net stand relatively separate from the simpler solutions that are available like node and python I’m not saying that that’s necessarily a huge Advantage for all cases because as you said observability with tools like Prometheus is mostly the same for any environment that you’ll use but if you’re using an APM Telemetry or a JFR ideally then you’re getting a lot more from java and the JVM or any language that runs on the JVM then you would by looking at a similar offerings from other platforms at this point in time and there is a lot to catch up there especially when we’re talking about doing that and performance because the impact of these tools on the jit and the runtime environment is severe especially in Python I’ve worked there on some tooling and even the most basic hello world where you do nothing the CPU drops like a stone in terms of performance it’s a very interesting exercise to try and alleviate that and I know that people in the node space are working on improving that but it has
[35:00] Been my experience that it’s a foremost part in environment when you try to deal with those those environments dotnet a bit excluded there because it’s it’s more mature in that sense just from my side because you talked about ATMs and Telemetry once the major problems that apms in the Java world have is that Java doesn’t have a really good API where you can just as an application or as an APM level can just say hi get me your stack trace for you cannot really you have to use JFR and that’s because one thing yeah so you’re working through that I’m working on that because many of the apms for example taking the APM from elasticsearch which is quite well used and from other people and also the APM from grafana they’re using asynchrit cultures and that’s an API developed in the beginning of the 2000s it’s not well supported and as you will probably read also in a blog post after this podcast came out it does some severe problems for example it doesn’t have enough testing and it can appear and can disappear all the time on essentially when Oracle says oh we
[36:24] Don’t want to maintain it anymore so I think Java has good parts it has not a great part and I think it’s still a way to go until we are in our Wonderland that many of us envisioned that we currently have yeah it does require a lot of tuning and familiarity the nice thing is that it’s very flexible you can write an agent a native code in Java and it sort of works seamlessly there are challenges and a lot of things behave one way in one version of the JDK and differently in a newer version but in terms of performance in terms of compatibility It’s relatively consistent for a very long time I can tell you that we worked with JDK 7 compatibility and things still work in JDK 17. and that’s fantastic we’re able to get really good performance and still be very backwards compatible on some of these rather complex things and as you mentioned by the way you didn’t mention the JEP version number 435 which you’ve submitted for asynchronous stack base VM API I’d recommend people who are interested in implementing these low-level calls to check this out and see what how it can impact
[37:56] Them another question I do have of for you all what bits of information are you typically looking for when debugging because in practice what I’m mostly looking at is things I need to reproduce my problem on my own computer because no matter how great tooling we have to do debugging in the cloud debugging on my local machine will always be suit easier furthermore if possible I can write it turn it into a unit test or integration test so I can just keep running over the scenario running a scenario over and over again so that helps me a lot in figuring things out so I’m mostly looking at I need stack traces or I need what request came in like the request buddy and such so I can reproduce things on my local machine is there any specific information that you are all looking for when debugging I use debugging also to sometimes check my understanding of the code so just to run through it or step through it and make sure that it is working the way that I think it does because sometimes you read code and make assumptions and it does something else or to check the value of a variable as it’s running
[39:11] Through the logic or to make sure that it hits a certain branch that you think it should hit so I use debugging for that as well I use evaluate expression quite a lot to maybe change some things and see what happens and the example that you’re giving is you’re running a unit test you need to have a reproducible example first so yes if I’m bug fixing I will if at all possible write a test that reproduces the problem to make sure that I understand the bug correctly that I get the same error message that I’m trying to fix or whatever else is going wrong and I also do definitely prefer doing that on my local computer but sometimes you don’t know what causes the bug so for that you can attach a debugger to a running application which we’ve also done in the past and then wait for the problem to appear That’s a thing where some observability tools could really come in handy which can help you with not having to actually run a debugger with what he talked about on the security issues and everything and that’s usually what I’m looking for in my observability tooling and of course a nice thing about running
[40:27] It to Oakley and writing a test for it after that you also have a test for it so you make sure that it can’t happen again in the future exactly killed a bit yeah exactly yes you have anything that specifically that you’re looking for that doing my help what I’m looking for is whether I know the back already so it’s it’s usually for me what I’m currently doing is it’s in the city cluster spot but you can also do this in travel world is that I have a small catalog of bugs that you already seen and I started to record these Sparks in like a text file to say okay here I had this bug or like this issue in this field and now when someone comes to me and says oh I have this problem with another API I can just say oh I know the spark already and here’s a solution that I did when I solved it in another part of the code or I can say oh let me look onto this and also what maritate I want to understand the code so it’s quite common for me to debug the code just to understand because when I’m like dropped in the new couples for example the OpenJDK or I don’t know working on IntelliJ understanding how
[41:42] Intelligent does debugging by debugging the Intel J debugger which is open sources it’s quite cool do it but your mind will be blown up in and being in pieces it’s quite interesting to just drop in so the breakpoint at the point C when it runs on it and then use the evaluate feature and thereby I was able to understand how the debugger uses the whole protocol stuff directly without having to comb through all the code because this is quite impossible for a large code base I specifically wrote the second chapter about within my book is about the theory of debugging and pretty much it echoes a lot of what you said where the process needs to go through a set of assumptions and oscillations and through the issue tracker this is actually when you’re talking about academic theory of debugging they specifically mention issue tracker which is weird fumion usually when I’m reading academic things one of the things that we talk a lot there is about the dailies and having an actual daily Standard meeting with the team when you’re working and communicating about the bug because that
[43:00] Sort of and this is kind of contrast to the rubber ducking portion actually talking to living people and listening to them because that really helps in some of those tight spots when you’re trying to find the right way to isolate something also there’s defensive coding which I know isn’t about tracking or reproducing the bud but there are coding techniques that we can use as part of our daily programming and the specific logs that we choose to log and how we build our tests and what we test and what sort of coverage not a hundred percent what sort of correct coverage we do that really helps and one of the tricks that I do that I love in order to reproduce something locally is not to try and reproduce it locally but try to reproduce the bug so if I see something that fails in IntelliJ I can go to a specific method and try to reproduce the situation by modifying the state of the JVM so one of the things I can do is the IntelliJ has a plug-in called jump to line which you can use to sort of drag the in the execution pointer to an arbitrary location and you can move back in the execution and just change the
[44:27] State of the VM with by setting the values of variables to match what you think the bug would be and then just step over and try to reproduce it locally just within the VM without changing the entire environment without adding all the data and then you can go over and over again sort of test live without recompiling without rebuilding and just redo everything over and over again right in the debugger and that’s a fantastic tool to retry some things that are harder some states that are harder to reproduce because of data in the servers but sometimes for production because of the scale of it you can’t possibly reproduce it locally and there we need some observability tools and also go into that quite a bit sorry a deep plug on the book there about the observability capabilities that you can inject there and develop observability which is very close to the way you debug locally but designed for the scale of production yeah that’s actually quite the tool too I didn’t hear what that’s very good for explorative exploratory debugging now that’s something I should look into there’s one more subject I do want to
[45:47] Talk about because I noticed that no matter the tools all the tools you have available the biggest mistake I UCC people make is I once helped someone in the morning because he was I’m having a buck can you help me so I helped him a bit and in the end of the day asking did you submen to solve it and so now I’m still busy I’m just trying to set this cookie and because that that’s what’s restricted me for solving this bug and then I figured I just asked him are you sure that setting that cookie will actually solve it and then he had to confess he didn’t actually know so okay let’s just do a small hack just set a cookie in a hacky way and just see what happens now oh it still goes wrong okay let’s say that’s another look and oh yeah it turns out something to be something completely different and that’s the thing I mostly see people doing wrong during debugging go in they already have an assumption and a hypothesis in there right in their heads to what might be the problem and basically everything they see they try to they get tunnel vision towards it and everything they see goes toward
[46:59] That hypothesis they had in the beginning and this is usually what causes the most time in debugging having the wrong hypothesis so if you have an hypothesis use all your tooling you have no matter how hacky it is to just make sure that your hypothesis is correct and then you can start with doing a proper solution and doing proper debugging but at least make sure that your problem areas correct yes you need a sort of tongue motion where both sides of the equation you sort of slowly move the tongs through and usually when you start running into a problem that becomes a deep problem it’s it’s a process that you can stop by double verifying every assumption and there are tools that you can use that sort of help you verify that assumption so for instance I can check in the ID and see that the application behaves one way but I will can also check it in using an external tool like jstack and things like that to verify various behaviors and once you have that sort of double verification you can slowly move the tongs between the tiers until you reach the area of the code that’s responsible and sort of
[48:17] Narrow the corner that bug in it’s sort of like a hunt in a way yeah and this is part of the theory that I talked about and above a small trick I also heard that that’s very helpful is by saying out loud what your assumptions are like I’m going to call this video with this and well indeeds it’s in that very form of rubber ducking but saying your assumptions out loud that I’m going to call this method with these arguments and assume it’s going to fail it makes it more true especially because we are as human beings we like to be right so if we make a certain if we call something and we only have in our heads what we expect it to be then if the result is different we just adjust whatever was in our head which is not a very efficient to the debugging by saying it out loud I’m calling this unexpected to fail if it suddenly succeeds it you can’t turn back anymore hey this is weird I should figure out what’s my assumption wrong or is the code basically actually doing something that I couldn’t that I didn’t expect so that that’s one of the biggest tricks I learned and it’s really helpful I’m also
[49:33] Curious what kind of information you’d look for if you don’t know where the bug is and a teacher example was I would try to reproduce it in unit test or check it locally of course that works if it’s functionality inside your application sometimes you have bugs that are caused by specific data on the production environment but you don’t know what it is I’m going to go with control characters or fun in XML for example a friend of mine told me where they switched OS that the JVM was running on and the new OS didn’t have a certain default that they needed in their application so these are things that sometimes you can’t reproduce locally so if you have like Johannes a Heisenberg where you study it and it goes away what are some of your techniques for tackling those is that one of my pet’s favorite bugs here is the data corruption bug where you suddenly start finding in the database bad data that came from some place and that you don’t know who inserted that data and it’s some part of your app that did that insert but you don’t know who who’s responsible for that what part of the code is
[50:54] Responsible for that because lots of code invokes that the problem is you don’t have a stack by this point because someone received the call to make that and the symptom is very problematic and there’s lots of those things where the symptom is so far away from the actual bug that there’s no stack Trace there’s no Trail Bar then it’s run dry and you sort of need to set a trap to find the bug but this is a problem because you need to leave the bug running in order to sort of Chase it back through that trap and find all the paths to it sometimes it’s unfortunate and this is the only way where we need to set a trap and just add verification to sort of find it and hope to reach that place correctly or Set something a constraint in the database and hope for that for the best another approach that we try to do to solve that before we reach that worst case scenario is to understand that separation between the root cause and the symptom itself because there’s still a limited amount of things that would for instance in the case of a bug that writes bad data to the databases still a limited amount
[52:16] Of code that can invoke something that would write bad data to the database and in those situations you start verifying trying yourself to cause that bug in an integration test and in every such integration test where you’re capable of doing that just plugging that old and preventing that sort of data and essentially I look at it as sort of hacking debugging where you try to cause to sort of hack your system blindly in all possible attack vectors it’s obviously a challenging approach but that’s the only way other than trapping which it isn’t a fun process to trap ideally if you have observability then you can sometimes track something back but that’s that’s difficult and you need a lot of logs to comb through and it’s not a trivial thing well the things you’re saying about as is going back to what you started with it’s by reducing the problem space there’s those are all the things you describe but just techniques to reduce the problem space and the question marriages it’s very difficult to answer since it’s it really specifically depends on what’s going wrong but the only generic answer
[53:42] For that is reduce the problem space with whatever means possible if that means indeed just setting traps doing lock statements that’s a way of reducing problem space doing all the hacking is just a way of reducing problem space running it on a previous jail all the JVM Justice because you did an upgrade just see does it still happen on the old JVM that’s reducing the problem space the context is it’s yeah it’s impossible to answer that but one step back the abstract way of working at it is asking yourself the question continuously how can I reduce the problem space and whatever means possible that that’s basically the only concrete answer I can give to that even though it’s not very concrete but I love context because that is our reservoc the type of application what type of information you need or what you need to look into yeah I think that you know with experience I really really love what Johanna said about keeping basically a bug collection of you know these are the bugs I’ve encountered and this is what was wrong I really love that because with experience you’re going to be like I’ve seen this before
[54:53] And it was you know this that or the other so that’s really cool and also what Shai said about your dailies and if you have a bug you know if you tell your team I have this bug someone might remember I’ve seen something similar I’ve also had debugging sessions where I was like okay something is going wrong let me check check you know one two three four five things I can’t find it go to the next developer can you help me fix this they checked the same five things okay that’s not it we go to the next developery checks the same five things and then checks number six and seven and finds what was wrong so yeah I’m a firm believer in also just helping each other out basically that Perry can help a lot but and also be conscious about these problem-solving techniques as in do not make assumptions producing problem space like these are things that if you get experience you automatically start doing and that’s what I noticed that it really helps to take a step back and consciously try to think in those terms that I should be doing this how can I do that instead of basically go with the flow and rely on experience yeah and to
[56:04] Get back to what we said earlier about technical tools that you like for debugging git bisect is great if you have a test that fails but you don’t remember when it started failing and speaking of discoverability I don’t think that’s really great on git either because if you’ve never heard of git bisect how are you going to know that even exists but yes it is a tool that I have used to locate when a bug started and in order to fix it so yeah I have a blog post on Foojay where I have a meme called that says our Lord and savior get bisect very much with that specific tool and those who might be listening and don’t know about it get bisect essentially discovers a regression for you automatically so if you have a regression in the code just tries all the permutations and finds the specific Revision in which the problem started I’d like to thank you very much first of all all the guests this episode and thank you for listening keep an eye on Foojay for future articles about development and everything related to the Java world thank you give me a jake give me the friends of OpenJDK
Found a mistake, or something to add? Edit this page on GitHub

Frank Delporte
Frank Delporte is a Java Champion, Java Developer, Senior Technical Writer at Azul, Blogger, Author of "Java Programming for Raspberry Pi - A Hands-On Guide to Electronics and IoT Projects", and Open-Source Contributor for Pi4J, Lottie4J, Sheetmusic4J, …

Johannes Bechberger
A JVM developer working on profilers and their underlying technology, e.g. JEP Candidate 435, in the SapMachine team at SAP.

Marit van Dijk
Marit van Dijk is a Java Champion and Developer Advocate at JetBrains with over 20 years of software development experience. She's passionate about building great software with great people, and making developers' lives easier. Marit regularly presents at …

Shai Almog
Author, DevRel, Blogger, Open Source Hacker, Java Rockstar, Conference Speaker, Instructor and Entrepreneur.